Path Analysis and PROCESS
PROCESS models in SmartPLS support path analysis and PROCESS analysis. Path analysis is a regression-based technique for estimating models with multiple dependent and independent variables. Unlike PLS-SEM, it is a one-step approach that uses equally weighted indicators when there are multiple measurements per construct, and it operates on unstandardized data. It mimics the results from the PROCESS macro in SPSS.
Understanding Path Analysis and PROCESS in SmartPLS
Path analysis (McDonald, 1996; Wright, 1921) is used to estimate a system of equations where all variables are observed. Unlike regression models, path models can include multiple dependent variables (system of regression models). In SmartPLS, the variables of a path model can be included as single-item constructs. When a variable is based on multiple indicators, they are assigned the same weights to obtain the construct scores. In principle, only the structural relationships between the observed variables (or equally weighted constructs), with or without control variables, are modeled. This type of model is often used when one or more variables are meant to mediate the relationship between two other variables (mediation models). Moderated mediations can also be modeled.
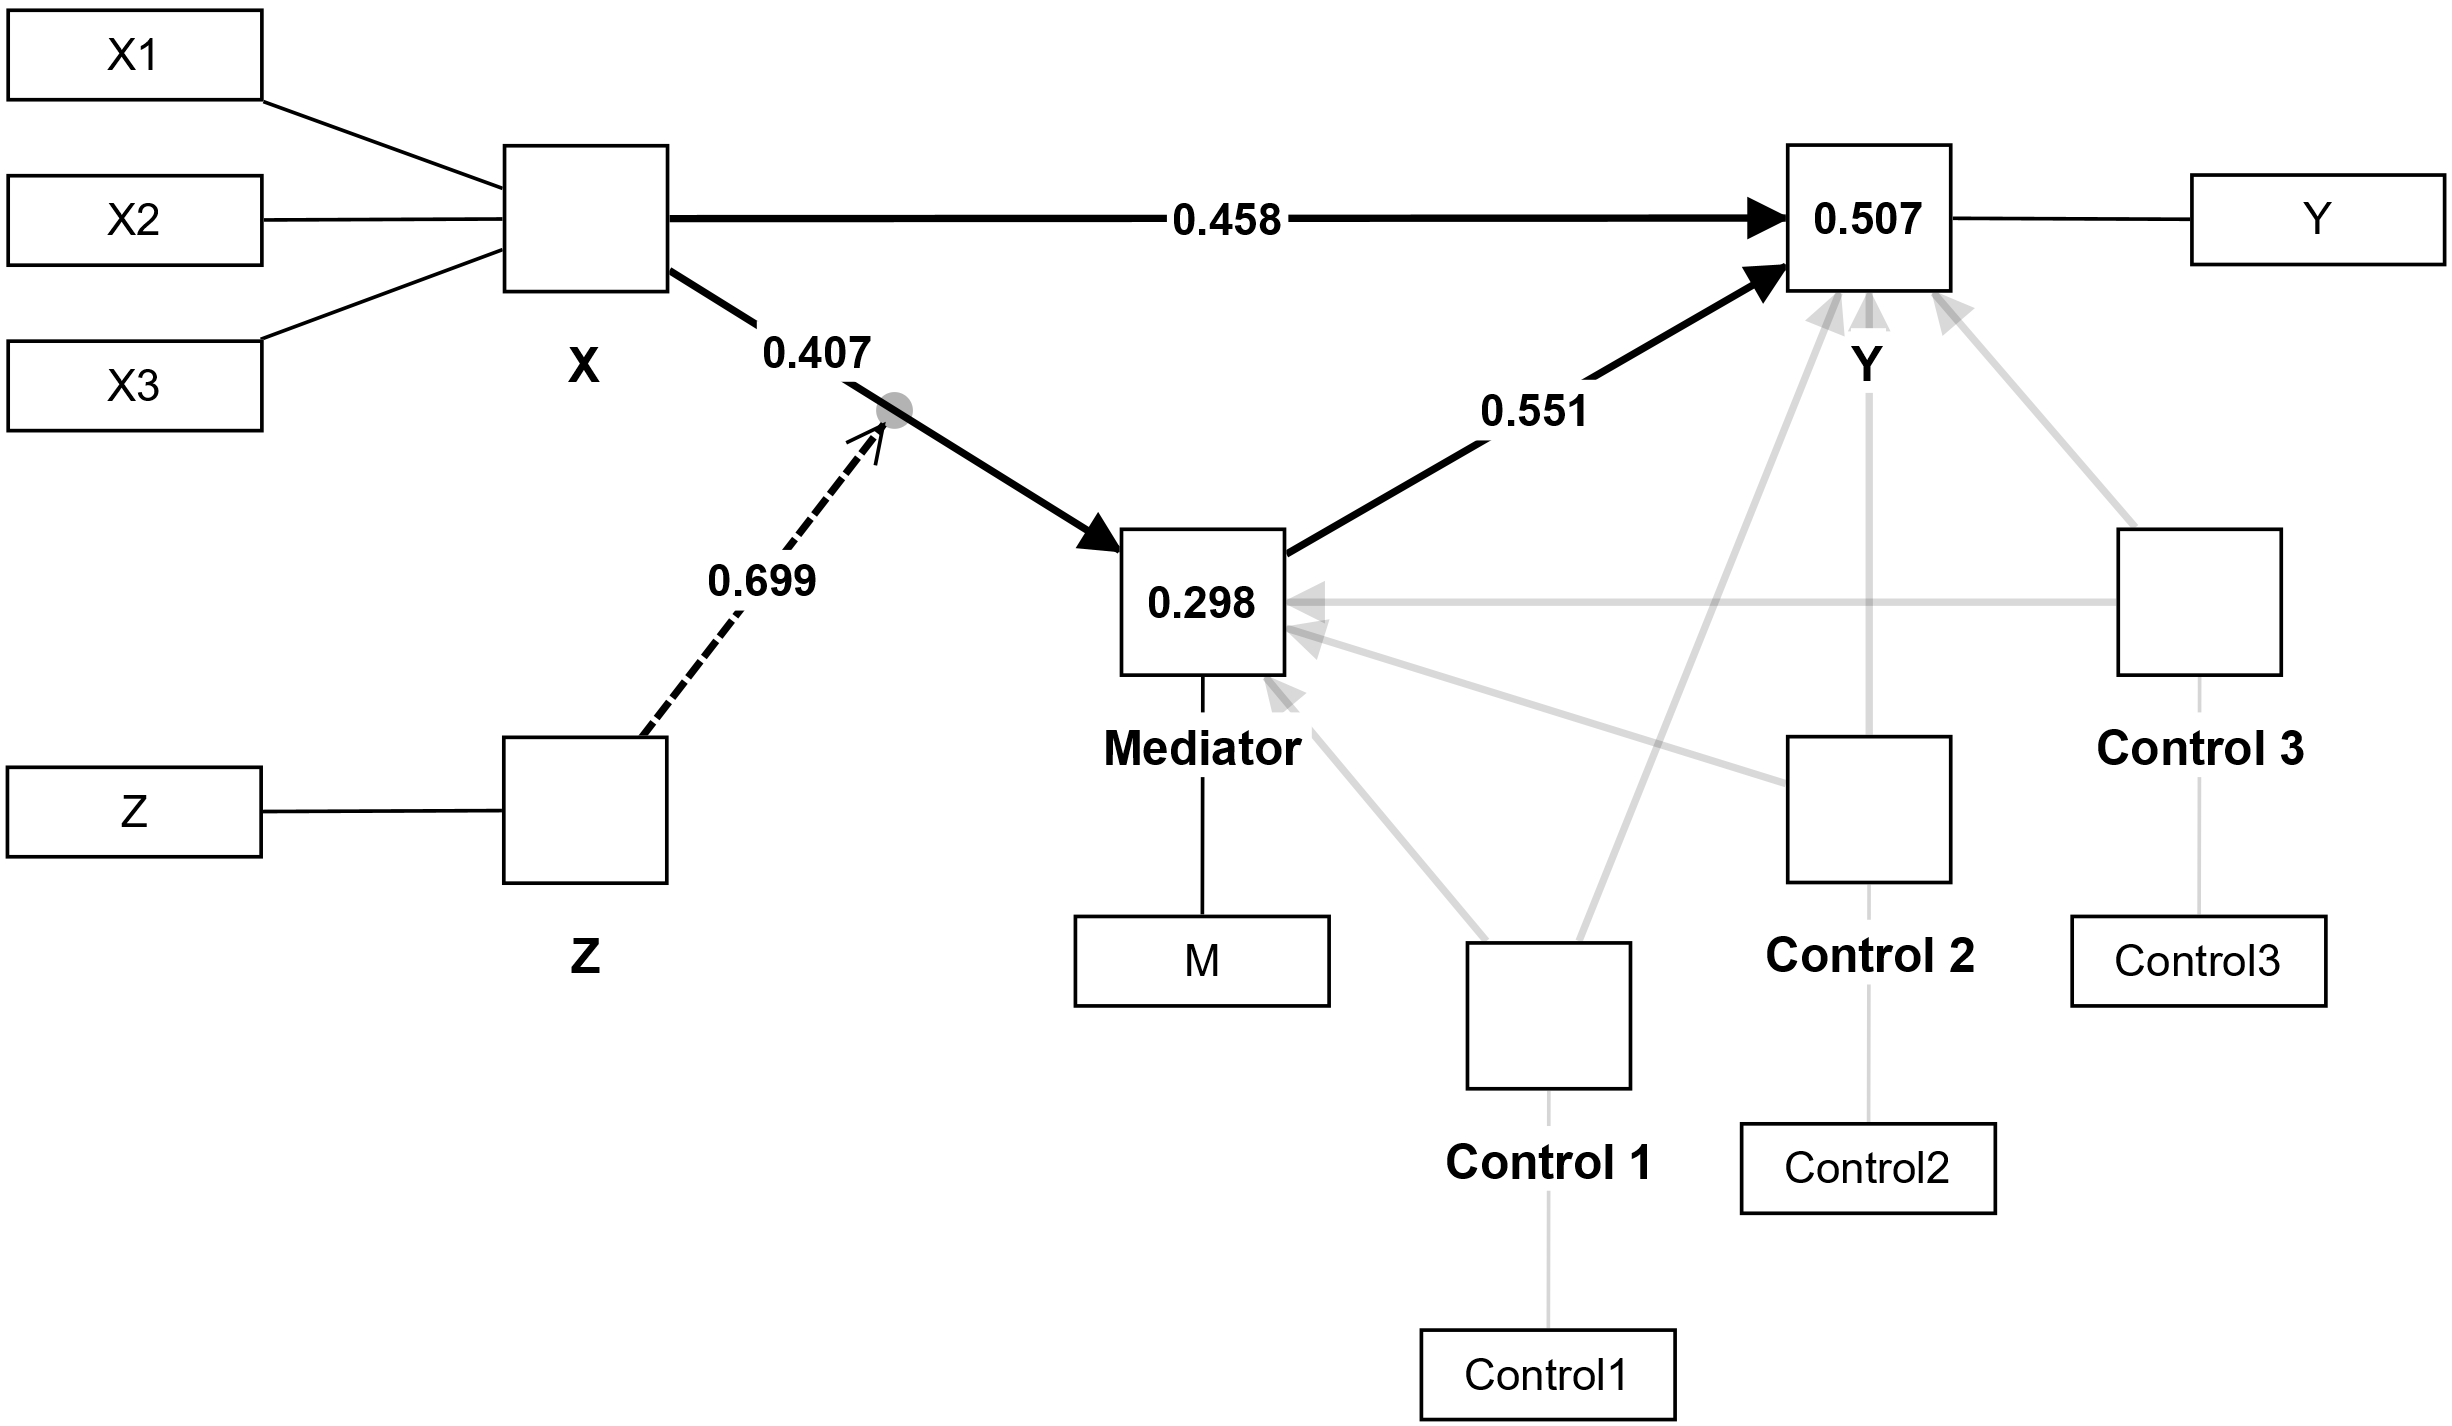
Bootstrapping in SmartPLS enables significance testing for the path model. Thus, the PROCESS module provides all modeling and calculation options that are classically offered for PROCESS (Hayes, 2018). The PROCESS models are automatically generated by SmartPLS and the results are output directly, so no additional calculations outside of SmartPLS are required (Sarstedt et al., 2020). The following figure shows a PROCESS model example in SmartPLS.
PROCESS Settings in SmartPLS
Data Metric
The option defines whether and how the input data should be transformed. Unstandardized leaves the data as it is. Mean-centered subtracts the mean from the variable (which might be useful to interpret interactions). Standardized subtracts the mean and divides by the standard deviation of the variable; the resulting variables have zero mean and standard deviation of one.
Control Variables
Check this box if your path model contains control variables.
Frequently Asked Questions
How does PROCESS handle constructs with multiple indicators?
In its original form, PROCESS only uses single (observed) variables. When constructs are created out of multiple variables, their composition needs to be done in advance by the user to obtain the data for the constructs (e.g., equally weighted sum scores). In contrast, SmartPLS's PROCESS implementation provides an automatic equal weighting of indicators when a construct has multiple indicators. However, it has to be clarified which sequence of steps is advantageous (e.g., summation of standardized indicators with subsequent standardization of the obtained construct scores or summation of the original data with or without subsequent standardization of the obtained construct scores, etc.).
How does path analysis in SmartPLS differ from PLS-SEM?
Path analysis is a one-step, regression-based approach that operates on unstandardized data and uses equally weighted indicators when a construct has multiple measurements. PLS-SEM, by contrast, iteratively estimates weighted composite scores as part of its algorithm.
What is a PROCESS model in SmartPLS?
SmartPLS's PROCESS module automatically generates path models that mimic the results of the PROCESS macro (Hayes, 2018) known from SPSS, including mediation, moderation, and moderated mediation models, and outputs the results directly without requiring calculations outside of SmartPLS.
Can I model mediation and moderated mediation with PROCESS in SmartPLS?
Yes. Path models are often used when one or more variables are meant to mediate the relationship between two other variables, and moderated mediations can be modeled as well.
What does the "Data metric" setting do?
It controls whether and how input data is transformed before estimation. Unstandardized keeps the data as is, mean-centered subtracts the mean from each variable, and standardized subtracts the mean and divides by the standard deviation, so the resulting variables have a mean of zero and a standard deviation of one.
How does SmartPLS handle constructs with multiple indicators in PROCESS models?
SmartPLS automatically applies equal weighting to the indicators of a construct with multiple indicators. This differs from the original PROCESS macro, where such composition has to be done manually by the user in advance (e.g., as equally weighted sum scores).
Related SmartPLS Methods
References
- Hayes, A. F. (2018). Introduction to mediation, moderation, and conditional process analysis: A regression-based approach (2nd ed.). Guilford Press.
- McDonald, R. P. (1996). Path analysis with composite variables. Multivariate Behavioral Research, 31(2), 239–270.
- Sarstedt, M., Hair, J. F., Nitzl, C., Ringle, C. M., & Howard, M. C. (2020). Beyond a tandem analysis of SEM and PROCESS: Use of PLS-SEM for mediation analyses! International Journal of Market Research, 62(3), 288–299.
- Wright, S. (1921). Correlation and causation. Journal of Agricultural Research, 20, 557–585.
- More literature ...
Cite correctly
Please always cite the use of SmartPLS!
Ringle, Christian M., Wende, Sven, & Becker, Jan-Michael. (2024). SmartPLS 4. Bönningstedt: SmartPLS. Retrieved from https://www.smartpls.com
